Bitcoin, the world’s first cryptocurrency, has had a wild ride since its creation in 2009. From being worth less than a penny to reaching values that rival some of the world’s largest assets, Bitcoin’s price history is full of highs, lows, and everything in between. One of the most talked-about milestones in Bitcoin’s journey is its All-Time High (ATH)—the highest price Bitcoin has ever reached.
This blog dives into what a Bitcoin ATH is, why it matters, and the key moments when Bitcoin broke its own records. Understanding Bitcoin’s ATH history can offer valuable insights into the broader crypto market and its long-term potential.
What is a Bitcoin ATH?
In simple terms, a Bitcoin ATH refers to the highest price Bitcoin has ever reached in its trading history. It’s a significant milestone that reflects moments of peak demand for Bitcoin, driven by market trends, adoption, and external events.
For example, Bitcoin’s ATH in December 2024 was $103,900.47, a number that captured global attention and reinforced Bitcoin’s position as a dominant cryptocurrency. (Source: CoinMarketCap)
But ATHs are more than just numbers—they can indicate market confidence. Every time Bitcoin sets a new ATH, it demonstrates its resilience, growing acceptance, and ability to thrive in an unpredictable financial world.
Bitcoin’s All-Time Highs Over the Years
Bitcoin’s price history is like a rollercoaster, marked by sharp rises and deep corrections. Let’s explore some of the key ATH milestones in Bitcoin’s journey and the events that shaped them.
2009-2013: The Early Days

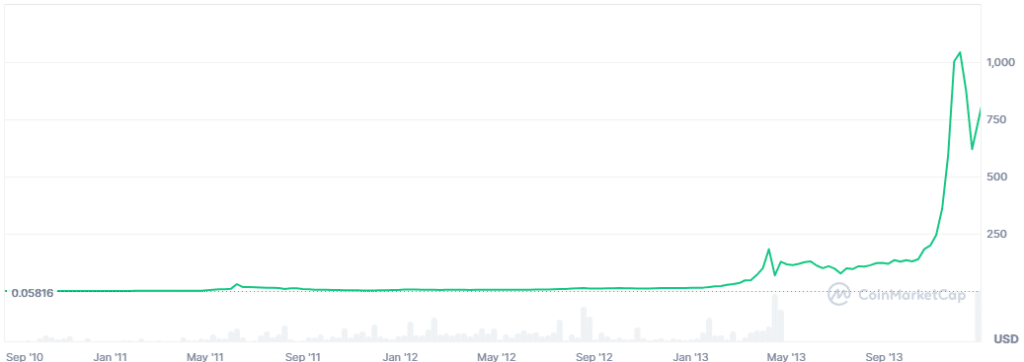
Price Range: $0.0009 to $1,163
Bitcoin’s first ATH came in December 2013, when its price hit $1,163. Before this, Bitcoin traded for fractions of a cent. Its rise was fueled by early adopters, tech enthusiasts, and the growth of platforms like Mt. Gox, which made Bitcoin easier to trade.
Events like Bitcoin Pizza Day in 2010, where 10,000 BTC were used to buy two pizzas, demonstrated Bitcoin’s real-world potential. By the end of 2013, Bitcoin had captured mainstream media attention, setting the stage for its future growth.
2014-2017: Rapid Growth and Volatility

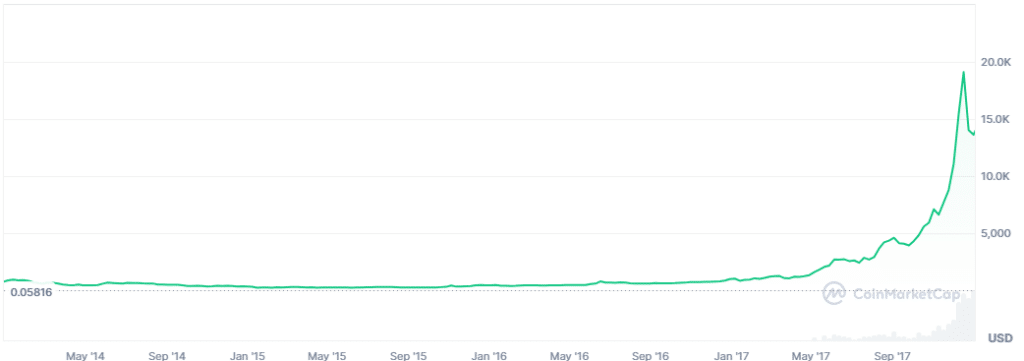
Price Range: $805 to $19,498
The years following 2013 were turbulent. Bitcoin hit new ATHs but also experienced significant crashes. Its next major milestone came in December 2017, when Bitcoin’s price skyrocketed to $19,498 during the ICO (Initial Coin Offering) boom. This period saw massive interest in cryptocurrencies, with Bitcoin at the center of it all.
Events like the Mt. Gox hack in 2014 and debates about Bitcoin’s scalability also defined this era, leading to the creation of altcoins like Ethereum and Bitcoin Cash.
2018-2020: Bear Market to Resurgence

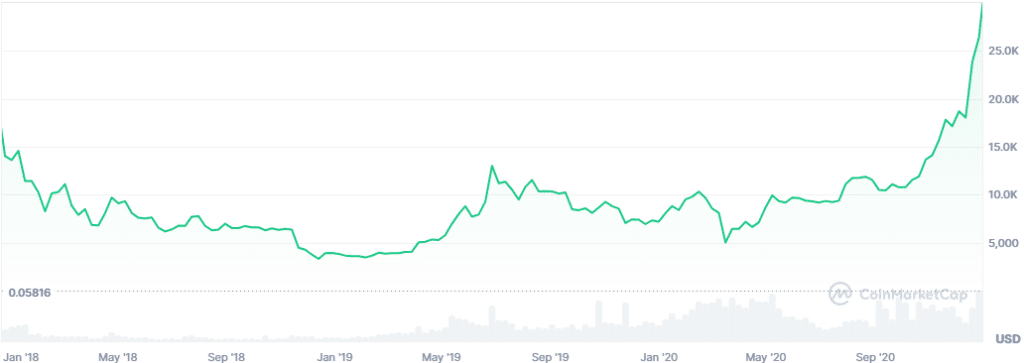
Price Range: $3,809 to $29,096
After the 2017 ATH, Bitcoin entered a bear market, with its price dropping to $3,809 in 2018. But the cryptocurrency proved its resilience. By December 2020, Bitcoin had recovered, setting a new ATH of $29,096. This resurgence was driven by institutional interest, with companies like MicroStrategy and Tesla buying Bitcoin as a reserve asset.
The COVID-19 pandemic also played a role, as investors sought alternatives to traditional assets during economic uncertainty.
2021-Present: The ETF Era and Beyond

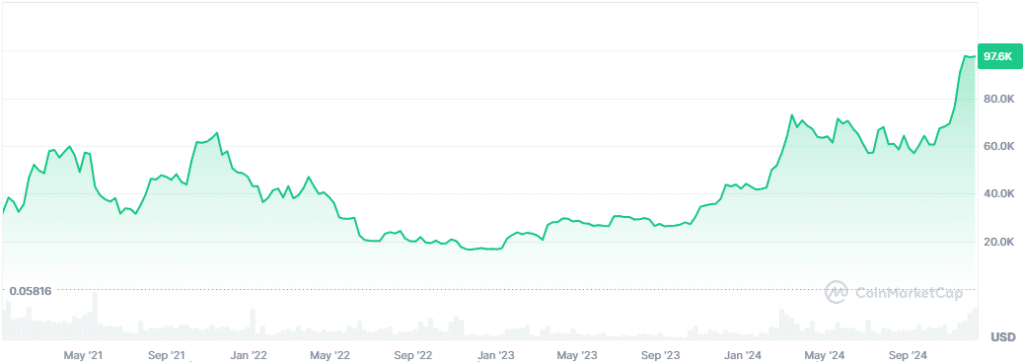
Price Range: $16,759 to $100K+
As of the time of writing, Bitcoin reached its highest ATH to date in December 2024, peaking at $103,900.47 according to CoinMarketCap. This record was driven by the approval of Bitcoin ETFs (Exchange-Traded Funds) and increasing institutional adoption. Governments like El Salvador even declared Bitcoin legal tender during this period.
While Bitcoin’s price has since fluctuated, the growing role of ETFs and mainstream acceptance signals a promising future.
Factors Influencing Bitcoin’s ATHs
Several factors drive Bitcoin’s ATHs, making them important indicators of the crypto market’s health:
Bitcoin Halving Cycles
Every four years, Bitcoin undergoes a halving, reducing the number of new coins mined. This event creates scarcity and has historically preceded price surges and new ATHs.
Market Sentiment
Positive news, like ETF approvals or institutional investments, often drives demand for Bitcoin, pushing prices higher. Conversely, fear, uncertainty, and doubt (FUD) can lead to corrections. The Fear & Greed Index is a commonly used tool to gauge market sentiment.
Macroeconomic Events
Bitcoin’s ATHs often coincide with economic crises, inflation fears, or changes in monetary policy, as people turn to Bitcoin as a hedge against traditional financial systems.
Adoption and Awareness
From companies adding Bitcoin to their balance sheets to countries adopting it as legal tender, growing adoption fuels confidence in Bitcoin’s value.
Bitcoin Price History Table
The table below summarizes Bitcoin’s price journey, highlighting its yearly highs, lows, and performance percentages:
| Year | Start | High | Low | EOY | % Change |
| 2010 | $0.003 | $0.40 | $0.00 | $0.30 | 9,900% |
| 2013 | $13.30 | $1,163 | $13 | $805 | 5,953% |
| 2017 | $966 | $19,892 | $784 | $14,245 | 1,375% |
| 2021 | $29,022 | $68,789 | $29,796 | $46,430 | 60% |
| 2024 | $42,577 | $103,900 | $49,602 | TBD | TBD |
Lessons from Bitcoin’s ATHs
Bitcoin is Resilient
Bitcoin has experienced significant price drops over the years, but it has also reached new ATHs following periods of recovery. This ability to rebound demonstrates its importance and growing role in the financial world. While past performance does not guarantee future results, Bitcoin remains a key player in the cryptocurrency market.
Adopt a Long-Term View
Bitcoin’s history is marked by both highs and lows, reflecting the natural cycles of any market. Short-term price changes can be dramatic, but looking at historical trends shows how Bitcoin has evolved over time. A broader perspective can help you better understand the factors that influence its value.
Be Informed
Knowing Bitcoin’s ATHs and the events that influenced them can provide valuable context for the cryptocurrency’s market behavior. Staying informed about historical trends and market developments can help you make more confident and data-driven decisions.
To learn more about Bitcoin and other cryptocurrencies, explore the RockItCoin blog or subscribe to our emails using the form at the bottom of the page for updates, tips, and news delivered right to your inbox!
Conclusion
Bitcoin’s ATH milestones tell a story of growth, resilience, and increasing adoption. Each ATH reflects not just Bitcoin’s value but the growing belief in its potential as a transformative financial asset. Whether you’re a seasoned investor or new to crypto, understanding these milestones can help you navigate the market with confidence.
Ready to take the next step? Visit a RockItCoin ATM or download the RockItCoin Go app to buy Bitcoin today!
FAQs About Bitcoin ATHs
What does ATH mean in cryptocurrency?
ATH stands for All-Time High. It refers to the highest price a cryptocurrency, like Bitcoin, has ever reached in its trading history. For Bitcoin, ATHs are key indicators of market sentiment and adoption milestones.
What was Bitcoin’s first ATH?
Bitcoin’s first ATH was $1,163 in December 2013.
What is Bitcoin’s highest ATH?
Bitcoin’s highest ATH to date is $103,900.47, reached in December 2024.
Is it smart to buy Bitcoin near an ATH?
Timing the market is difficult. Focus on your long-term investment goals instead of chasing highs.
The information provided in this blog is for informational purposes only and should not be considered financial, investment, or legal advice. Cryptocurrency investments carry risks, including the potential loss of principal. Always conduct your own research and consult with a licensed financial advisor before making any investment decisions. RockItCoin does not guarantee the accuracy, completeness, or timeliness of the information presented in this article.


